

The Bee’s knees sustainability blog
How to hack sustainability reporting
If you've ever looked at your dashboard readouts and thought: "How on earth do I turn this into an interesting story?" this is for you. We'll walk you through step by step of how to take your data and transform it into narrative magic.
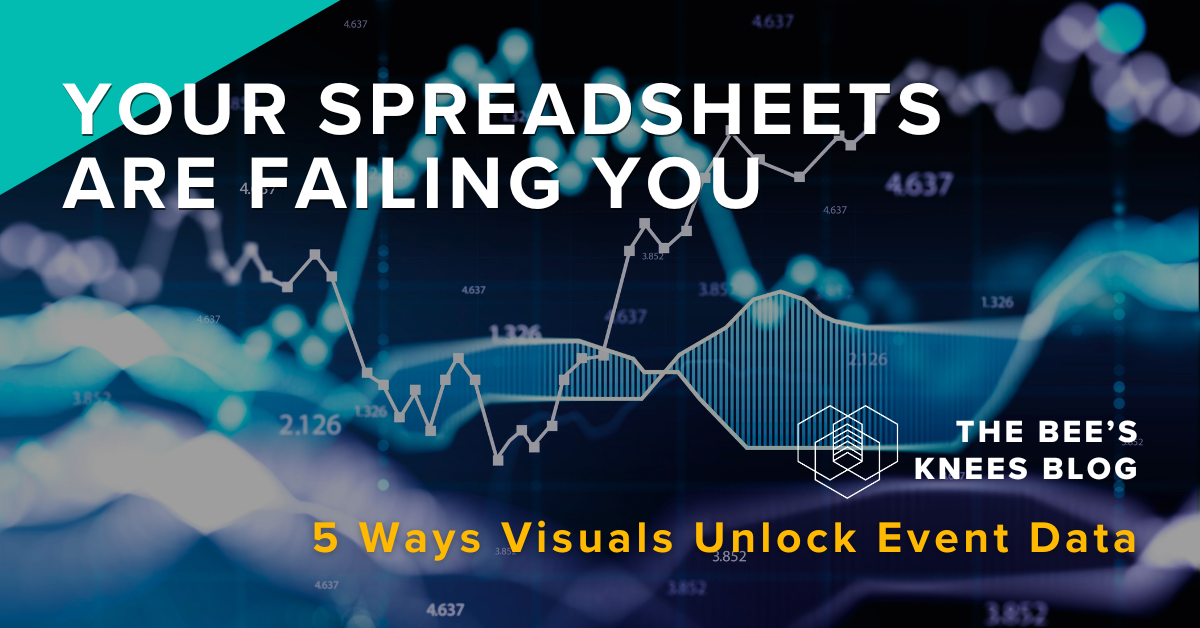
YOUR SPREADSHEETS ARE FAILING YOU
We’re revealing 5 ways to look at event data that finally tell us what the numbers mean. Using examples from HIVE, award-winning Honeycomb Insights for Venues and Events dashboard, we’ll share five readouts that help you interpret and actually understand your data so your events can go beyond baseline and start making sustainable progress.